
KPIs — Leads, Cost, ROI, Clients
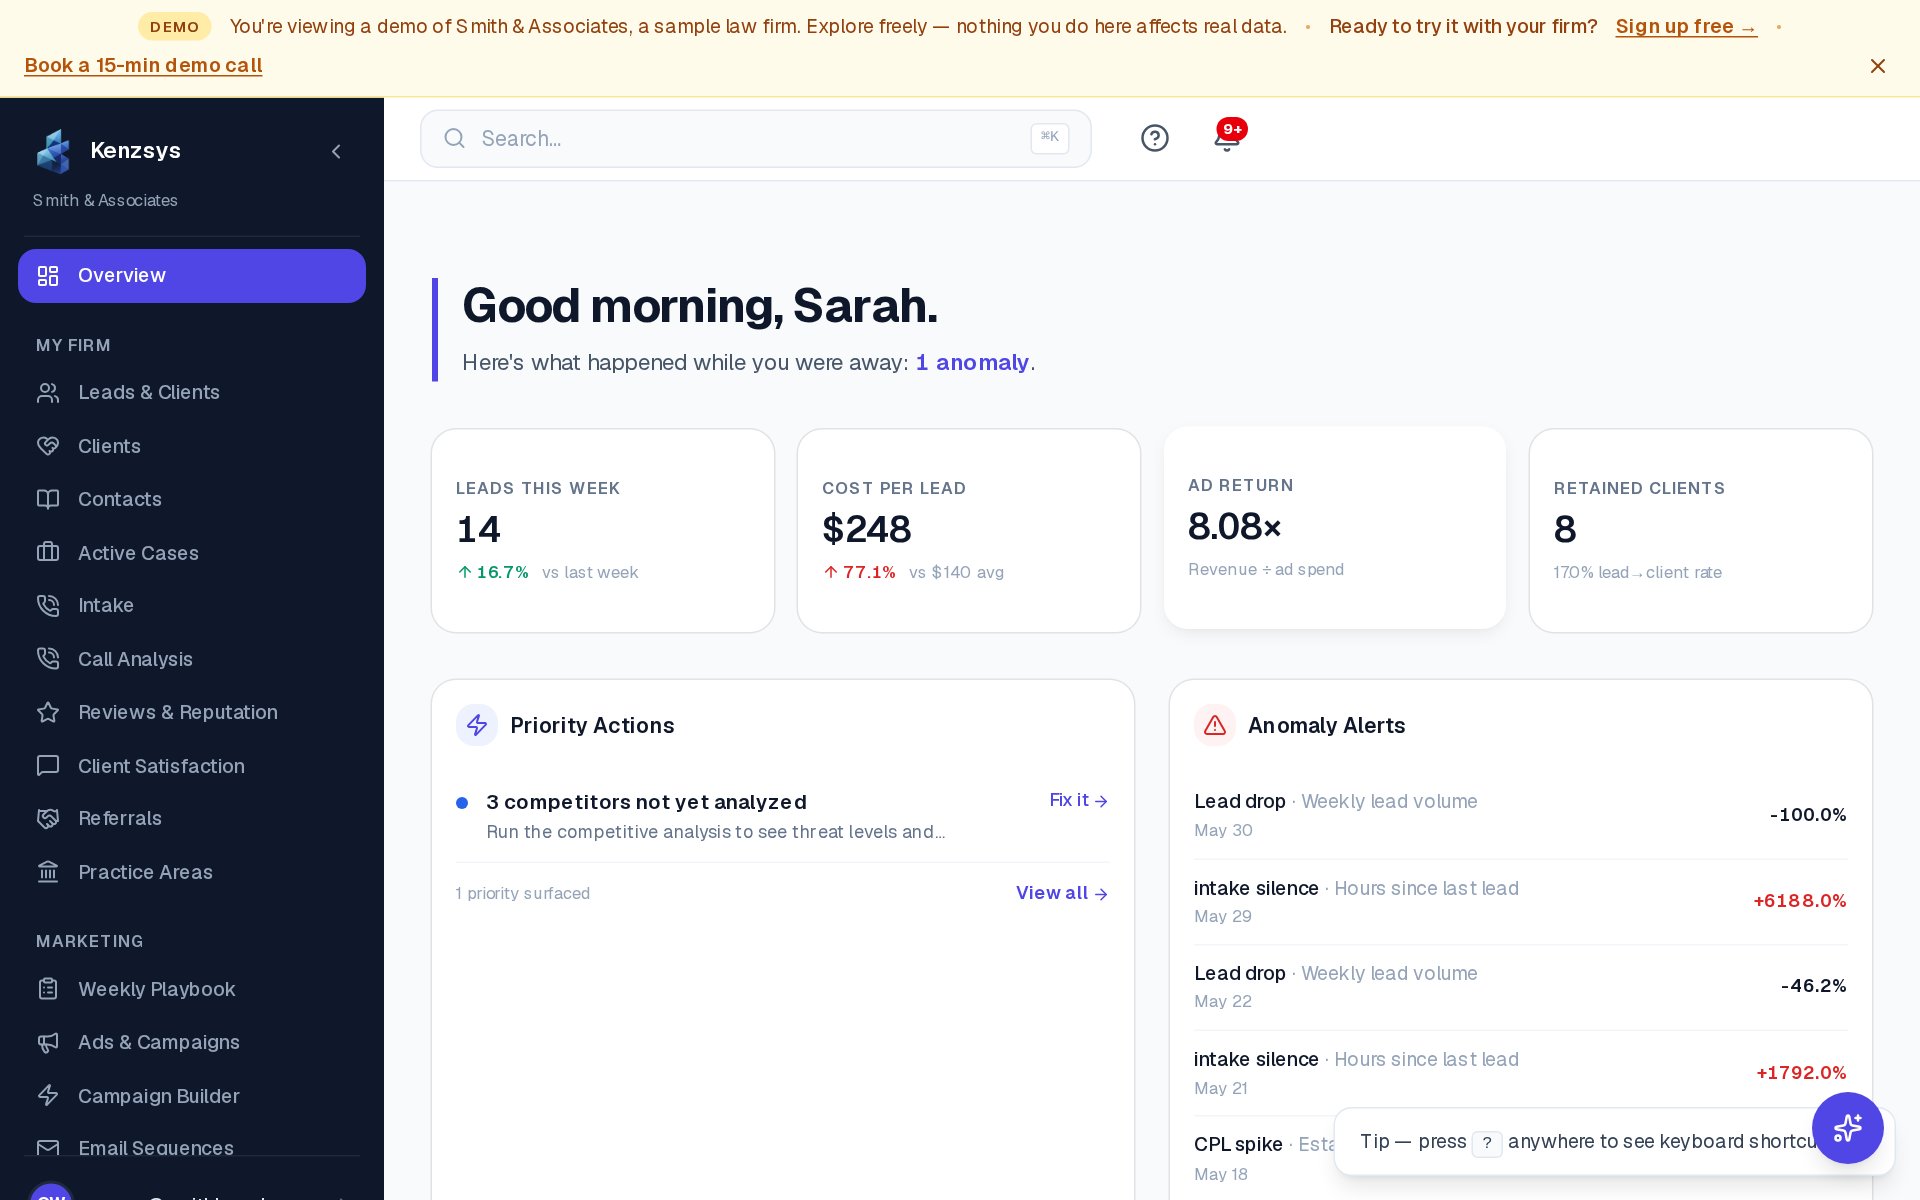
The four KPI cards at the top of the dashboard are the headline numbers every owner and marketing manager should know. This page explains exactly what each one measures, where the underlying data comes from, what "good" looks like for a law firm, and what you need connected to unlock each metric.
1. Leads This Week
The total number of unique inbound leads in the selected date range. A "lead" is any person who contacted your firm through a tracked channel — a phone call captured by CallRail, a form submission on your website, a click-to-call from Google Ads, or a message via Google Business Profile. Repeat contacts from the same phone number or email within 30 days count as one lead.
What good looks like: heavily dependent on practice area and ad budget. A small family law firm might see 15 to 30 leads per week as healthy, while a PI firm spending six figures monthly may see 200+. Use the period-over-period comparison (green/red percentage below the number) as your first signal — a 25% drop week-over-week deserves investigation.
Required: at least one of CallRail, Google Ads, or a connected web form.
2. Cost Per Lead (CPL)
Total marketing spend in the period divided by the number of leads in that period. Spend is pulled automatically from connected ad platforms (Google Ads, Meta) and can be supplemented with manually entered channels (sponsorships, print, billboards) under Reports > Channels.
What good looks like: varies widely by practice area. A reasonable benchmark for PI firms is $100 to $400 CPL on Google Ads; family law often sits at $80 to $200; criminal defense is typically $150 to $500. What matters more than the absolute number is the trend — a CPL that creeps up 20% over three months without a corresponding increase in retention is a sign that targeting or creative needs attention.
Required: a connected ad platform (Google Ads or Meta).
3. Ad Return
Total revenue from retained clients in the period divided by total ad spend in the period, expressed as a multiple. An Ad Return of 4.2x means every dollar of ad spend produced $4.20 of case revenue. Revenue comes from Clio billing data; spend comes from connected ad platforms.
What good looks like: 3x is generally break-even for a firm carrying overhead; 5x to 10x is healthy; anything below 2x sustained is a sign the marketing mix needs work. Be aware that Ad Return is a trailing indicator — cases retained this month may have started as leads 60 to 90 days ago.
Required: Clio integration and at least one connected ad platform. Until both are connected, this card shows "Connect Clio and Google Ads to unlock."
4. Retained Clients
The number of leads that became paying matters in Clio during the date range. Kenzsys matches leads to matters automatically using phone number and email. Ambiguous matches go to a manual review queue surfaced inside the Leads page.
What good looks like: the most important conversion rate to watch is retained ÷ leads. PI firms typically convert 5% to 15% of leads to retained clients; family law 10% to 25%; criminal defense 8% to 20%. Below 5% sustained suggests an intake problem, not a marketing problem.
Required: Clio integration. Without it, this card shows "Connect Clio to track retained clients."
Period-over-period comparison
Below each big number is a small percentage in green or red — the change versus the prior equivalent period. If you have "Last 7 days" selected, the comparison is to the 7 days before that. Green means improvement (more leads, lower CPL, higher Ad Return, more retained clients). Red means the metric moved in the wrong direction.
Tip: Don't read a single week's KPIs in isolation. Open the Performance Trends chart below the KPIs to see whether a change is a true shift or normal week-to-week noise.